Shopify Checkout Conversion Benchmarks 2026: What's Actually Good?
The full benchmark set for Shopify checkout conversion in 2026, by tier, vertical, device, and traffic source. What separates the top 10% from the median, with the methodology behind every number.
In this article
- 01 What’s a good Shopify checkout conversion rate?#
- 02 What about overall site conversion rate?#
- 03 Mobile vs desktop conversion benchmarks#
- 04 Conversion benchmarks by industry vertical#
- 05 Conversion by traffic source#
- 06 New vs returning customer benchmarks#
- 07 Cart-to-checkout vs checkout-to-purchase#
- 08 Top decile patterns: what’s actually different about the top 10%?#
- 09 Conversion benchmarks by AOV band#
- 10 Conversion by month and seasonality#
- 11 How to calculate your own checkout conversion rate#
- 12 What’s a good lift target from optimization work?#
- 13 A short summary#
The most common question we get from Shopify operators is some version of: “is my checkout conversion rate any good?” The answer is almost always “it depends on what you compare to,” because checkout conversion varies more by vertical, device, and traffic source than by store quality.
This post is the reference benchmark set for Shopify checkout conversion in 2026, based on aggregated data from 5,000+ Shopify storefronts and cross-referenced with Shopify’s published merchant benchmarks and Littledata’s ecommerce research.
The companion data piece on abandonment specifically is in Shopify checkout abandonment statistics. The fixes-oriented pillar is the Shopify checkout optimization guide.
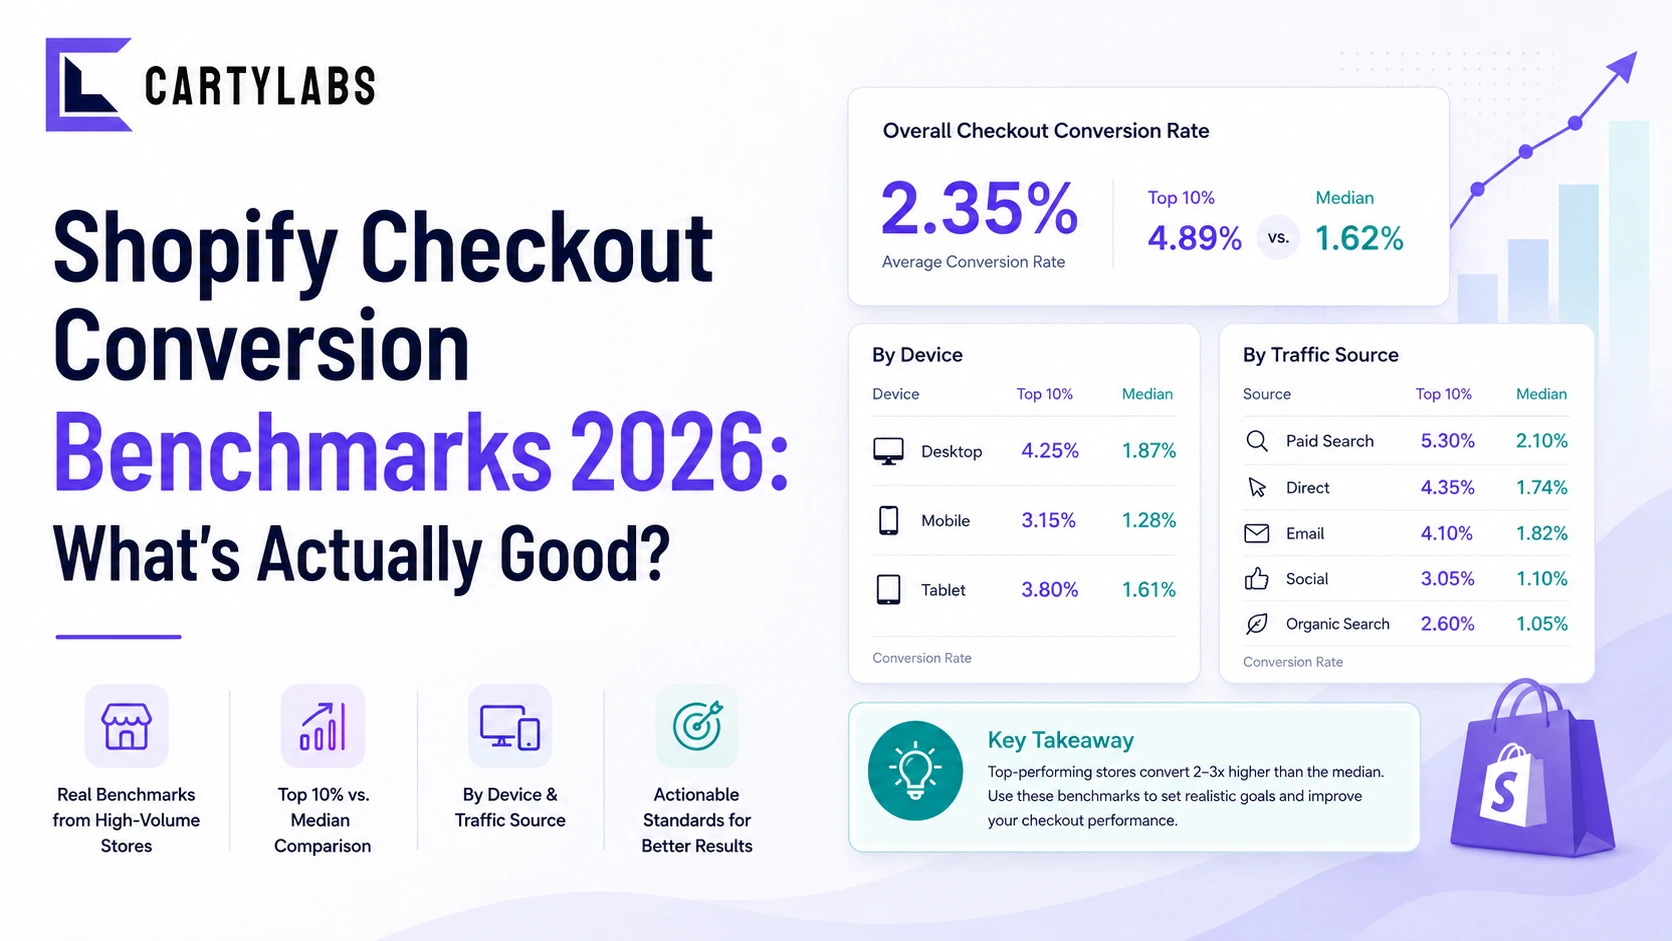
What’s a good Shopify checkout conversion rate?
The single headline benchmark: checkout-completion rate. The percentage of shoppers who start checkout and place an order.
| Tier | Checkout completion rate |
|---|---|
| Top 10% | 60-75% |
| Top 25% | 52-60% |
| Median | 38-48% |
| Bottom 25% | 28-38% |
| Bottom 10% | Under 28% |
If you’re at 45%, you’re average. If you’re at 55%, you’re top quartile. If you’re at 65%+, you’re elite, and you almost certainly have a returning-customer-heavy mix.
These are blended across all traffic, all devices, all customer types. The dispersion within a single store across those dimensions is wider than the dispersion between stores at the same tier.
What about overall site conversion rate?
The other commonly-cited number is site conversion rate: sessions that become orders, from any starting point. Aggregated 2026 medians:
| Tier | Site conversion rate |
|---|---|
| Top 10% Shopify stores | 5.0-7.5% |
| Top 25% | 3.5-5.0% |
| Median Shopify store | 2.0-3.0% |
| Bottom 25% | 1.0-2.0% |
| Bottom 10% | Under 1.0% |
This number is more useful for marketing and ad-channel ROI math but less useful for diagnosing checkout-specific issues. A store with a 2% site conversion rate could have a great checkout (60% completion) and bad upper funnel, or a bad checkout (30% completion) and great upper funnel. Always look at checkout-completion separately.
Mobile vs desktop conversion benchmarks
Within the same store, mobile typically runs 40-60% of the desktop conversion rate. Specific medians:
| Device | Checkout completion | Site conversion |
|---|---|---|
| Desktop | 48-58% | 3.0-4.5% |
| Mobile | 35-45% | 1.5-2.5% |
| Tablet | 45-55% | 2.5-3.8% |
The mobile gap has narrowed since 2021 (it used to be a 3x gap; now it’s roughly 1.5-2x) thanks to Shop Pay, Apple Pay, and Shopify’s mobile checkout improvements. But the gap is structural enough that mobile-heavy stores have to work harder for the same blended number.
If your mobile is more than 60% behind your desktop, you have a fixable mobile-specific problem. See Shopify mobile conversion optimization for the playbook.
Conversion benchmarks by industry vertical
The widest source of variance. Aggregated 2026 medians for checkout-completion rate:
| Vertical | Median completion rate |
|---|---|
| Food and beverage | 55-65% |
| Beauty and cosmetics | 48-58% |
| Health and supplements | 50-60% |
| Apparel and accessories | 42-52% |
| Sporting goods | 44-54% |
| Pet products | 50-60% |
| Home and furniture | 32-42% |
| Electronics | 38-48% |
| Jewelry | 28-38% |
| Cannabis and CBD | 30-40% |
The pattern: low-AOV, low-consideration, frequently-replenished categories convert highest. High-AOV, high-consideration, one-off-purchase categories convert lowest.
If your store is in jewelry and you’re hitting 35%, you’re top half of your vertical even though you’re below the global median. Always benchmark within vertical first, then within tier.
Conversion by traffic source
The other large source of variance. Aggregated medians for site-level conversion rate by source:
| Traffic source | Median conversion |
|---|---|
| Direct | 3.5-5.0% |
| 4.0-6.5% | |
| Organic search | 2.5-3.8% |
| Paid search (Google Ads) | 2.0-3.0% |
| Paid social (Meta/TikTok) | 0.8-1.8% |
| Display retargeting | 1.5-2.5% |
| Affiliate or referral | 2.0-3.5% |
| AI search (ChatGPT, Perplexity) | 3.5-6.0% |
The newcomer worth noticing: AI search referrals convert at 3-4x the rate of paid social and 1.5-2x the rate of organic search. The volume is still small (typically 2-8% of total organic) but it’s the highest-quality traffic on most stores. Strategy in our generative engine optimization for Shopify post.
Paid social converts low because most paid-social shoppers are interrupted from a feed, not actively searching. Don’t compare paid-social ROI to organic without normalizing for this.
New vs returning customer benchmarks
The single largest variance within a store. Median checkout completion rate:
- First-time visitor: 28-40%
- Returning visitor (no prior purchase): 40-52%
- Returning customer (one prior purchase): 55-68%
- Returning customer (3+ prior purchases): 65-80%
This is why a store’s blended completion rate is heavily a function of customer-base maturity. A 2-year-old store with a strong repeat customer base will routinely hit 55%+ blended. A brand-new store with all first-time visitors might top out at 40% no matter how clean the checkout is.
The implication: don’t chase blended completion as your only metric. Track new vs returning separately and optimize each cohort against its own benchmark.
Cart-to-checkout vs checkout-to-purchase
Inside the checkout funnel itself, two distinct stages:
- Cart-to-checkout rate (shopper enters cart and clicks “Checkout”): median 45-60%
- Checkout-to-purchase rate (shopper started checkout and placed order): median 38-55%
The first is mostly about cart-page UX, cart-drawer design, and free-shipping visibility. The second is mostly about checkout-page UX, trust, and payment options.
Most stores have a clear weaker stage. If cart-to-checkout is low, work on the cart. If checkout-to-purchase is low, work on the checkout itself. Diagnose first.
Top decile patterns: what’s actually different about the top 10%?
We pulled the operational patterns from stores consistently hitting top-decile checkout numbers. The shared characteristics:
- Express payment is top-of-page. Shop Pay, Apple Pay, and Google Pay are surfaced above the email field on 100% of top-decile stores. Average stores bury them in the middle or below.
- 3 or fewer shipping options. Choice paralysis is real. Stores with 5+ shipping options run 4-7 points lower completion than stores with 3.
- No required account creation. Account creation is optional or post-purchase on every top-decile store we audited.
- Free shipping threshold visualized in checkout. A progress bar showing “you’re $X from free shipping” inside the checkout pages, not just in cart.
- One-line guarantee near payment. A short money-back or shipping guarantee within visual distance of the place-order button.
- Smart shipping and tax calculation. Real numbers before payment entry, with currency formatted to the shopper’s locale.
- Returning-customer recognition. Detection of returning shoppers via Shop Pay or email, with appropriate pre-fill.
None of these are exotic. They’re all expressible through Shopify’s Checkout Extensibility plus reasonable theme settings. The gap between the top decile and the median isn’t a technology gap. It’s a “have you actually done the work” gap.
Conversion benchmarks by AOV band
Higher AOV stores convert lower, almost mechanically:
| AOV band | Median checkout completion |
|---|---|
| < $30 | 50-62% |
| $30-$75 | 42-55% |
| $75-$150 | 38-50% |
| $150-$300 | 30-42% |
| $300-$750 | 22-35% |
| $750+ | 15-28% |
This is one of the most predictable patterns in ecommerce: shoppers pause longer before committing larger amounts. A jewelry store at 30% completion isn’t doing worse than an apparel store at 50%. They’re each doing well within their AOV band.
If you want to lift conversion at high AOV, the levers are different: financing and BNPL options (Klarna, Affirm, Shop Pay Installments), explicit guarantees, and trust badges become much higher leverage than they are at low AOV.
Conversion by month and seasonality
Predictable seasonality patterns:
- Q4 (Nov-Dec) is the highest-conversion quarter. Gift intent runs hot and shoppers are deliberate. Black Friday week itself can run 1.5-2x normal completion rate on prepared stores.
- Q1 (Jan-Feb) is the lowest-conversion quarter. Post-holiday hangover, returns volume.
- Q3 back-to-school window (Aug-Sept) is a strong secondary peak for apparel, beauty, and electronics.
When benchmarking, normalize for season. Comparing your January conversion to your December conversion is comparing apples to grapefruit.
How to calculate your own checkout conversion rate
Inside Shopify Admin, the cleanest computation:
Checkout completion rate = Orders placed / Checkouts startedCheckouts started is the count of checkout_started events. Orders placed is the count of completed orders from those checkouts.
In GA4, the equivalent path is begin_checkout event count → purchase event count, filtered to the same date range.
Two gotchas:
- Shop Pay accelerated checkout sometimes skips
checkout_starteddepending on your event setup. If it does, your completion rate will look artificially high. Audit your event firing. - B2B and draft orders can pollute the numerator if you process wholesale orders through normal checkout. Filter them out for honest consumer-funnel benchmarking.
Track this monthly at minimum, weekly if you’re running active tests. Don’t read into weekly fluctuations more than ±3 percentage points. That’s normal noise.
What’s a good lift target from optimization work?
If you’re starting at the median (40-45% checkout completion), a realistic 90-day target is +5-10 percentage points from sustained optimization. That’s a 12-25% relative lift, translating to roughly 8-18% net revenue lift on the same traffic.
If you’re starting at top-quartile (52-58%), the law of diminishing returns kicks in. Expect +3-5 points over 90 days, with each subsequent point harder to extract.
If you’re starting bottom-quartile (under 38%), you have the largest opportunity. Expect +8-15 points over 90 days, with the first 5-8 coming from friction reduction alone.
A short summary
A “good” Shopify checkout completion rate in 2026 is 45-55% blended, with top decile stores reaching 60-75% on the back of returning customers, clean express payments, and visible trust signals. Mobile runs 10-15 points behind desktop within the same store. Vertical, AOV, and traffic source each shift the benchmark by 10-20 percentage points.
Don’t benchmark globally. Benchmark to your vertical and AOV band first, then your traffic mix, then your customer-base maturity. And separate cart-to-checkout from checkout-to-purchase so you know where to fix.
Want the levers that move you from median to top decile? Read the Shopify checkout optimization guide.
Install Cartylabs free on Shopify. Every top-decile lever shipped pre-built, 14-day free trial.
Related reading: Checkout abandonment statistics, One-page vs multi-step checkout, AOV optimization for Shopify.
Keep reading
All articles →Guest Checkout vs. Account Creation on Shopify: Which Wins in 2026?
Should you force account creation or offer guest checkout on Shopify? Data-backed comparison of conversion, retention, LTV, and the hybrid post-purchase signup pattern that beats both.
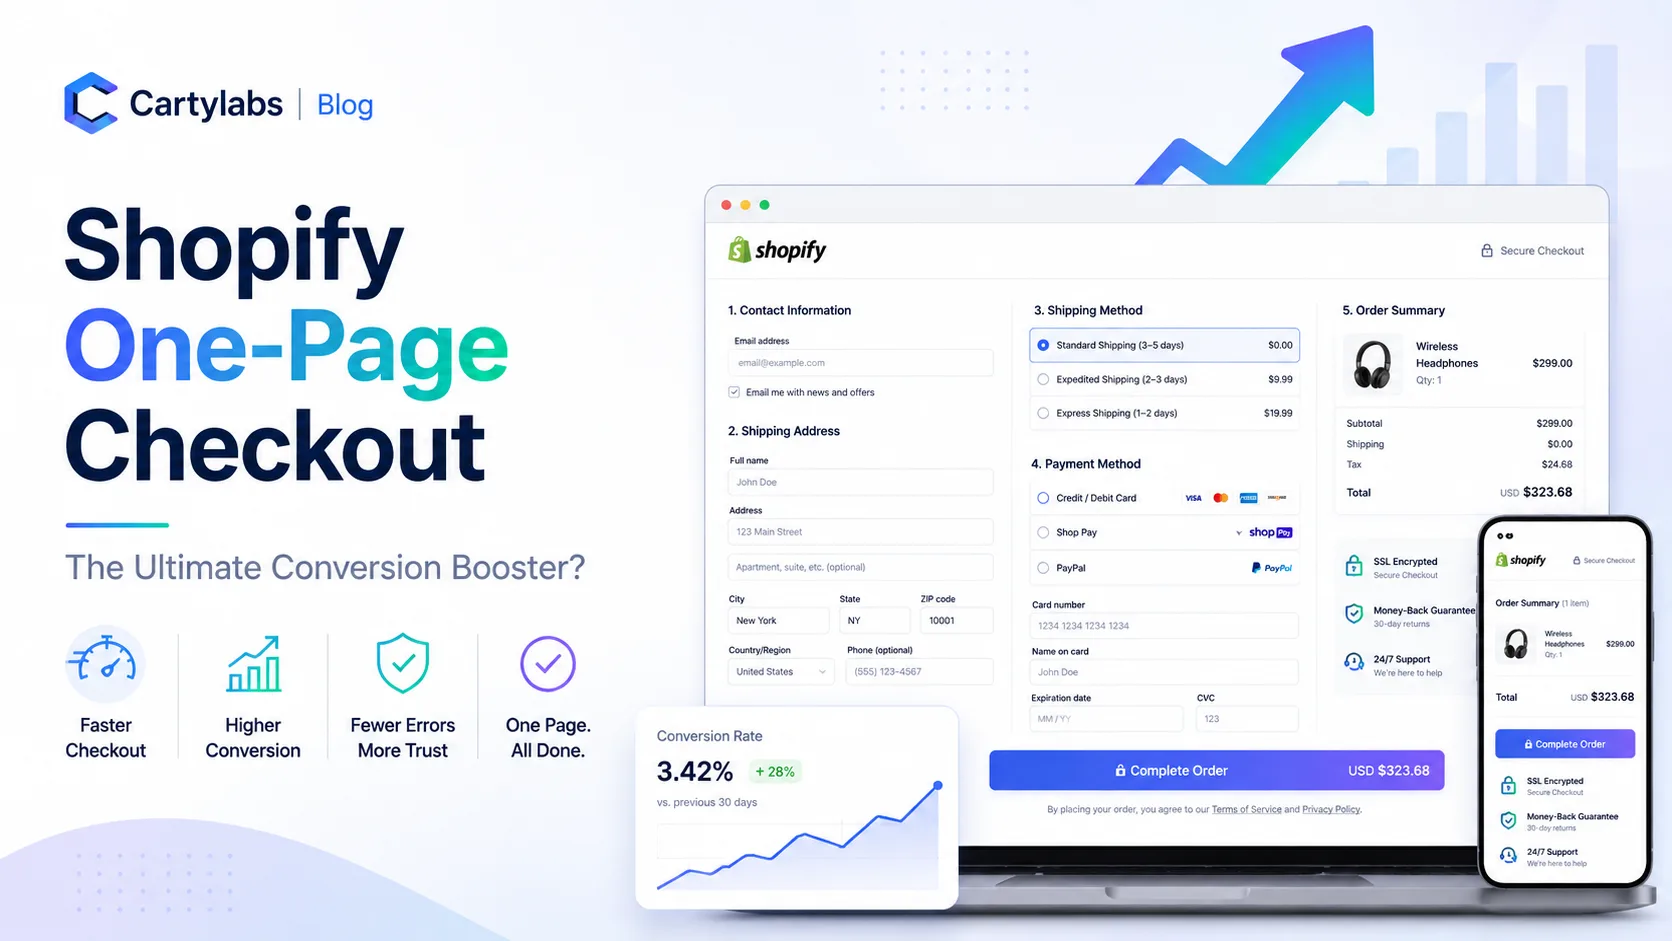
Shopify One-Page Checkout: The Ultimate Conversion Booster?
Does Shopify one-page checkout actually beat multi-step in 2026? A data-backed look at conversion gains, mobile trade-offs, and exactly when to switch your store.
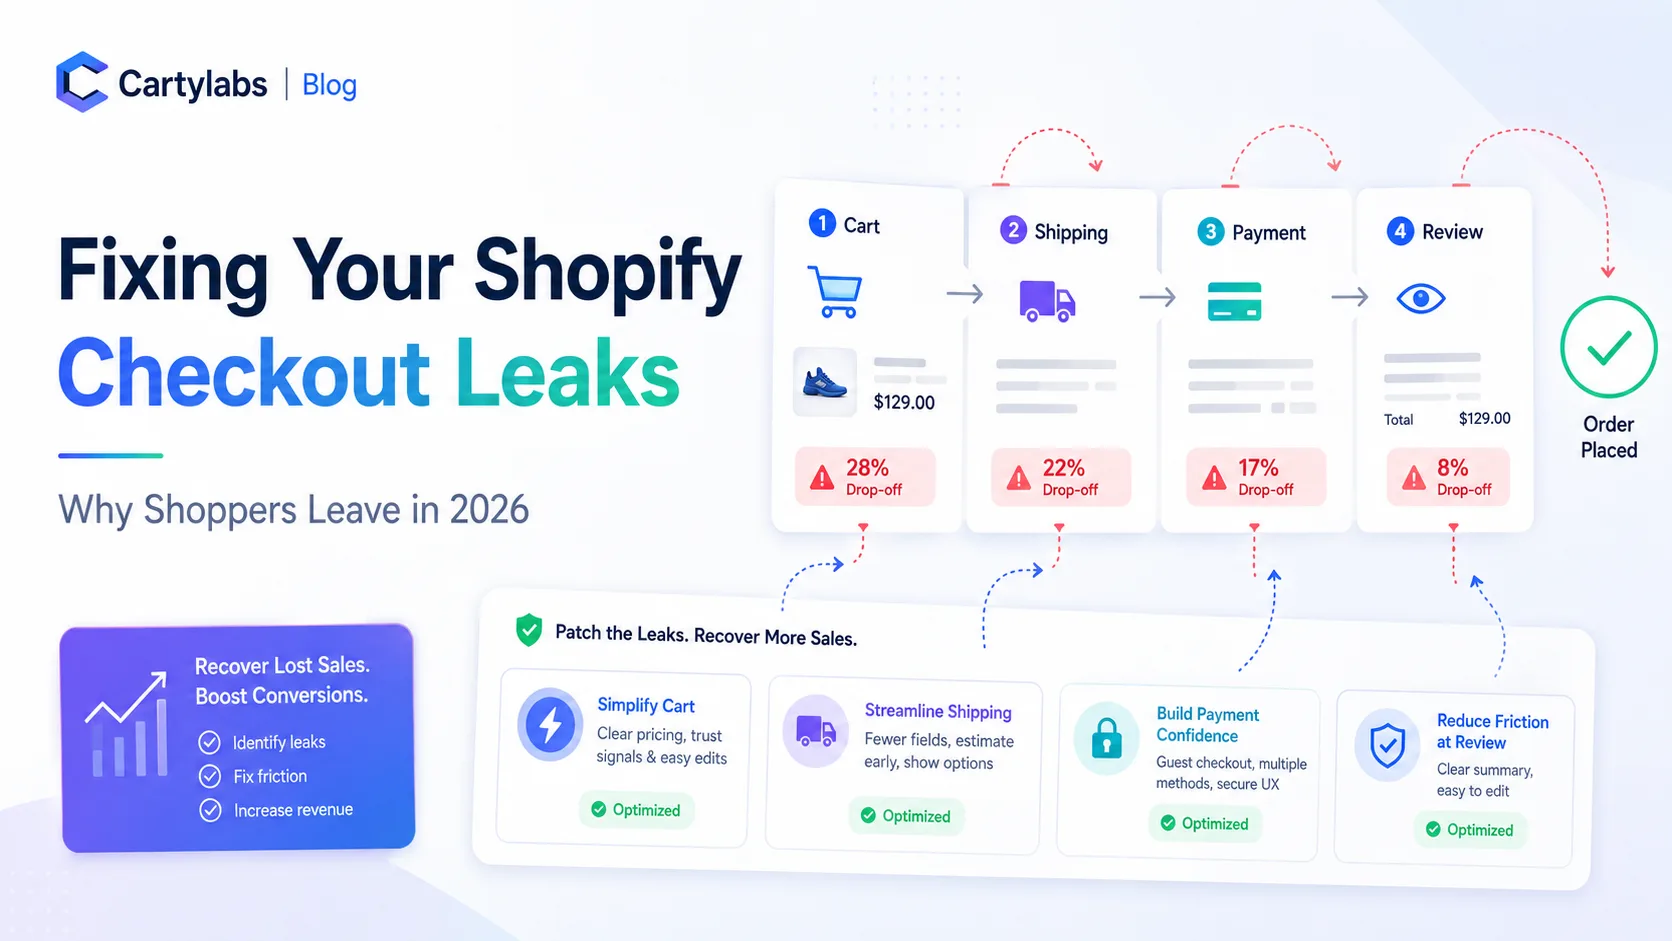
Why Shoppers Leave: Fixing Your Shopify Checkout Leaks in 2026
Diagnose Shopify checkout drop-off step by step using a leak-detection framework that maps abandonment causes to specific UX fixes for cart, shipping, payment, and review screens.