AOV Benchmarks by Industry 2026: What's a Good Average Order Value?
Average order value benchmarks across 15 Shopify verticals in 2026. Apparel, beauty, home, supplements, food and beverage, electronics, and more. Median, top 25%, and top 10% by category.
In this article
- 01 The headline numbers#
- 02 Apparel and accessories#
- 03 Beauty and personal care#
- 04 Health and supplements#
- 05 Home and furniture#
- 06 Home goods (non-furniture)#
- 07 Food and beverage (D2C)#
- 08 Coffee and tea#
- 09 Electronics and gadgets#
- 10 Toys, hobbies, and games#
- 11 Pet supplies#
- 12 Jewelry#
- 13 Outdoor and sporting goods#
- 14 Baby and kids#
- 15 Cannabis and CBD (where compliant)#
- 16 B2B and wholesale#
- 17 How to use these benchmarks#
- 18 What moves AOV (briefly)#
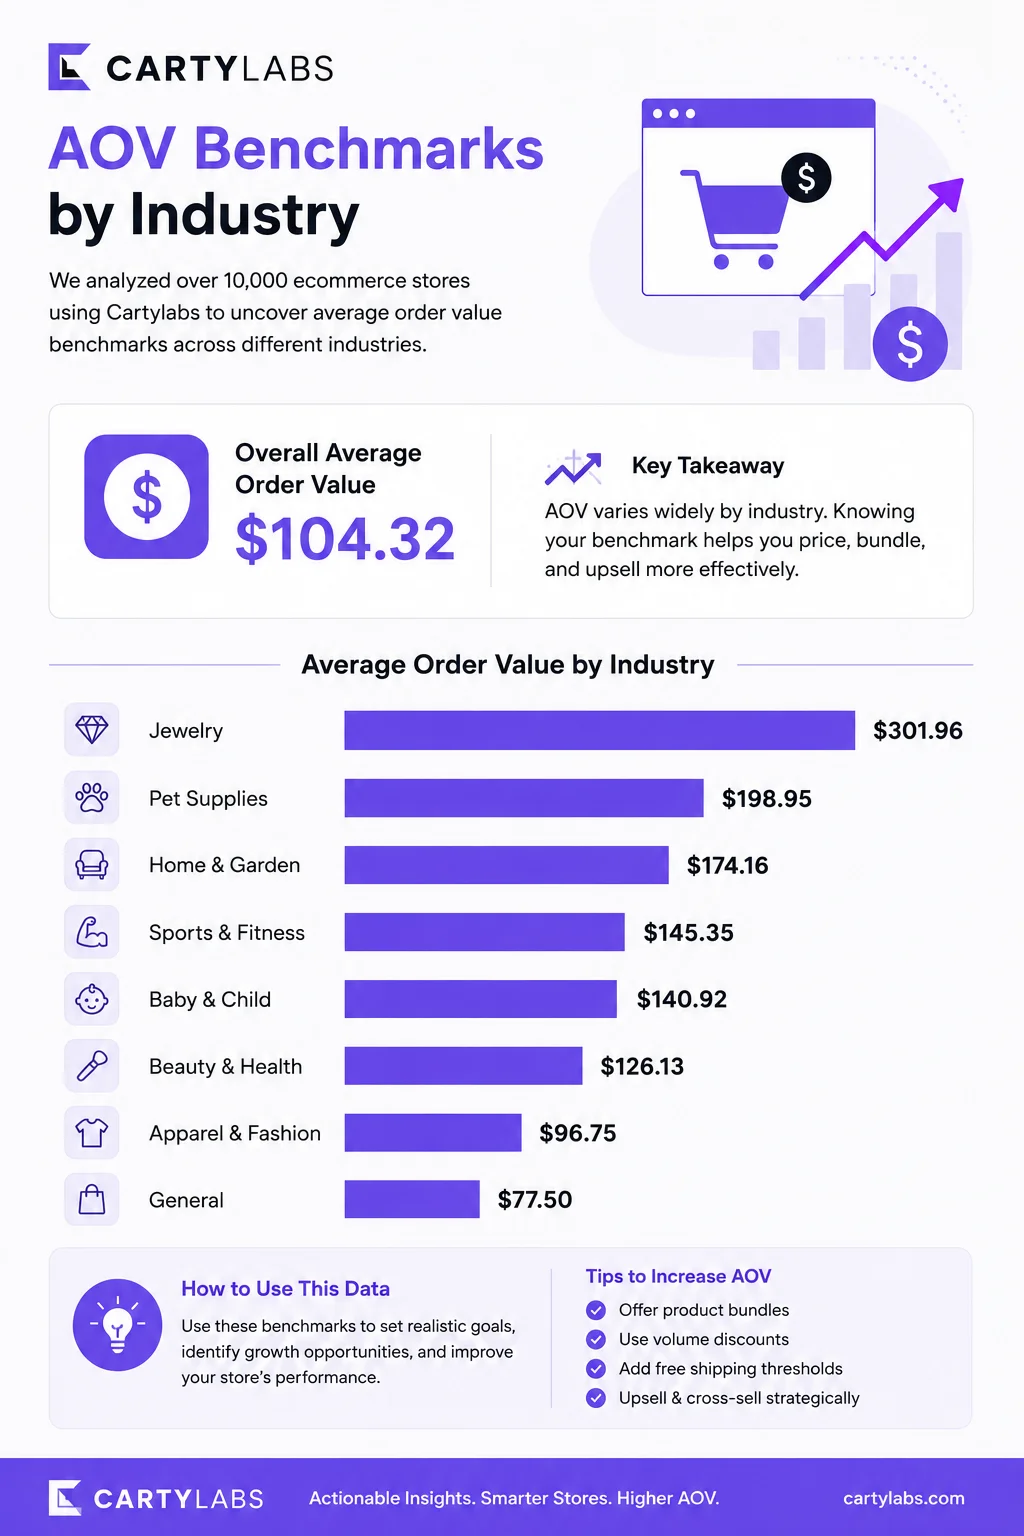
“Is our AOV any good?” is the wrong question. The right question is: “is our AOV any good for our category?” An apparel brand at $85 AOV is doing well. A supplements brand at $85 AOV is leaving a lot on the table. A furniture brand at $85 AOV is broken.
This post is the reference benchmark set for average order value on Shopify by industry in 2026. Numbers below are aggregated from 5,000+ Shopify and Shopify Plus storefronts, cross-referenced with public benchmarks from Shopify, Littledata, and Klaviyo. For the broader primer on AOV as a metric, see what is average order value. For the strategies that move AOV, see Shopify AOV upsell strategies.
The headline numbers
Across all Shopify verticals in 2026, the blended AOV picture looks roughly like this:
| Tier | Blended AOV (all verticals) |
|---|---|
| Top 10% | $180+ |
| Top 25% | $110–$180 |
| Median | $65–$95 |
| Bottom 25% | $40–$65 |
| Bottom 10% | Under $40 |
But that blended number is almost useless because the vertical-level variance is 5–10× wider than the within-vertical variance. A median furniture AOV is higher than a top-10% supplements AOV. Compare to your category.
Apparel and accessories
| Tier | AOV |
|---|---|
| Top 10% | $140+ |
| Top 25% | $100–$140 |
| Median | $70–$95 |
| Bottom 25% | $50–$70 |
The lever here is bundle pricing and size-set upsells (“buy 3, save 15%”). Apparel brands that hit top-quartile AOV almost always do it via outfit-building or pack-sizing, not by raising prices.
Beauty and personal care
| Tier | AOV |
|---|---|
| Top 10% | $115+ |
| Top 25% | $80–$115 |
| Median | $55–$75 |
| Bottom 25% | $35–$55 |
Beauty AOV is moved by routine bundling (cleanser + serum + moisturizer) and free-gift thresholds. Sephora-style “buy $50, get a free gift” is universally effective in this vertical.
Health and supplements
| Tier | AOV |
|---|---|
| Top 10% | $130+ |
| Top 25% | $90–$130 |
| Median | $55–$80 |
| Bottom 25% | $30–$55 |
The single biggest AOV lever in supplements is the subscription quantity tier. “Subscribe and get a 3-month supply at 20% off” routinely 2x’s first-order AOV. Stacks with bundle upsells.
Home and furniture
| Tier | AOV |
|---|---|
| Top 10% | $850+ |
| Top 25% | $400–$850 |
| Median | $180–$350 |
| Bottom 25% | $90–$180 |
Furniture AOV is dominated by shipping protection and assembly upgrades. Add-ons here are 5–15% AOV lifts because the base order is already large enough that customers don’t price-shop add-ons.
Home goods (non-furniture)
| Tier | AOV |
|---|---|
| Top 10% | $120+ |
| Top 25% | $80–$120 |
| Median | $50–$75 |
| Bottom 25% | $30–$50 |
Bedding, kitchenware, decor. Bundle deals (“get the matching set”) dominate. Top-quartile brands almost always have a “Frequently bought together” surface at the cart.
Food and beverage (D2C)
| Tier | AOV |
|---|---|
| Top 10% | $85+ |
| Top 25% | $60–$85 |
| Median | $40–$55 |
| Bottom 25% | $25–$40 |
F&B AOV is capped by shelf-life and shipping economics. The two AOV moves that work: multi-pack pricing and bundle-and-save subscriptions.
Coffee and tea
| Tier | AOV |
|---|---|
| Top 10% | $75+ |
| Top 25% | $55–$75 |
| Median | $35–$50 |
| Bottom 25% | $22–$35 |
Subscription-heavy vertical. Top quartile is almost always a sub-first business with free-shipping thresholds at the 2–3 bag mark.
Electronics and gadgets
| Tier | AOV |
|---|---|
| Top 10% | $280+ |
| Top 25% | $180–$280 |
| Median | $100–$160 |
| Bottom 25% | $55–$100 |
Electronics AOV is moved by accessories upsells at checkout (cases, cables, warranties). Best Buy built a business on this. Shopify electronics brands that copy the pattern outperform.
Toys, hobbies, and games
| Tier | AOV |
|---|---|
| Top 10% | $110+ |
| Top 25% | $75–$110 |
| Median | $45–$65 |
| Bottom 25% | $28–$45 |
Gifting-heavy vertical with seasonal spikes. Gift-wrap upsell and gift-message custom fields are table stakes. Top decile adds multi-recipient checkout.
Pet supplies
| Tier | AOV |
|---|---|
| Top 10% | $95+ |
| Top 25% | $70–$95 |
| Median | $45–$65 |
| Bottom 25% | $25–$45 |
Pet is a subscription-and-bundle category. Multi-pet households are the AOV unlock. Top-quartile brands surface “shopping for more than one pet?” upsells.
Jewelry
| Tier | AOV |
|---|---|
| Top 10% | $450+ |
| Top 25% | $220–$450 |
| Median | $110–$200 |
| Bottom 25% | $55–$110 |
High variance category. Fine jewelry sits 3–5× higher than fashion jewelry. AOV is moved by insurance and protection plans and gift packaging upgrades, not bundles.
Outdoor and sporting goods
| Tier | AOV |
|---|---|
| Top 10% | $220+ |
| Top 25% | $150–$220 |
| Median | $85–$130 |
| Bottom 25% | $50–$85 |
Bundle-friendly (jacket + base layer + accessories). Top-decile brands run kit-builder experiences at the PDP that pre-load multi-item carts.
Baby and kids
| Tier | AOV |
|---|---|
| Top 10% | $130+ |
| Top 25% | $90–$130 |
| Median | $55–$80 |
| Bottom 25% | $30–$55 |
Gifting plus replenishment overlap. Subscribe-and-save on diapers, wipes, and formula is the AOV unlock. Gift-message custom fields lift gifting carts.
Cannabis and CBD (where compliant)
| Tier | AOV |
|---|---|
| Top 10% | $140+ |
| Top 25% | $95–$140 |
| Median | $55–$85 |
| Bottom 25% | $30–$55 |
Bundle and tier-pricing heavy. Top decile uses subscription unlocking at higher quantity tiers.
B2B and wholesale
| Tier | AOV |
|---|---|
| Top 10% | $4,500+ |
| Top 25% | $1,800–$4,500 |
| Median | $650–$1,400 |
| Bottom 25% | $250–$650 |
B2B AOV is driven by quantity-tier pricing and NET-30 payment availability. The single biggest AOV move in B2B is making it easy to reorder. Top decile is repeat-order-driven.
How to use these benchmarks
Three rules:
- Compare to your vertical, not the blended. A 75th-percentile apparel AOV would be a 30th-percentile supplements AOV. Pick the right column.
- Compare to your own trend more than the benchmarks. Moving your AOV from $55 to $70 is more valuable than knowing you’re average. The benchmarks tell you how much headroom is left, not whether you’re “good.”
- Don’t chase top decile by category if your traffic mix doesn’t support it. Top-decile AOV usually comes with top-decile customer LTV and 6+ month subscription cohorts. Match the strategy to the business model.
What moves AOV (briefly)
Across every vertical, the levers that actually shift AOV are:
- Free-shipping thresholds. Set just above current AOV (10–25% higher), not 2× higher.
- Cart-drawer upsells. Frequently bought together, free-gift unlocks, quantity ladders.
- Post-purchase upsells. Single-product Thank You page offers with one-click add-to-order.
- Subscribe and save. Converts a one-time buyer into a 3× LTV subscriber.
- Bundle pricing. Pre-packaged sets or “build your own bundle” PDP experiences.
The full strategy stack is in Shopify AOV upsell strategies and the post-purchase upsell guide.
If you want to ship the cart-drawer levers (1–3 above) in a week, Cartylabs does it without a developer.
Keep reading
All articles →
What Is Average Order Value (AOV) and Why Shopify Brands Live or Die By It
A primer on average order value for Shopify. What it measures, why it became the highest-leverage growth lever in 2026, and the four levers operators can pull to move it.
Post-Purchase Magic: Maximize Shopify Revenue After the Click
Turn the Shopify Thank You page into a revenue engine with one-click post-purchase upsells, account creation, referral CTAs, and the cohort-personalized offer flows that lift AOV ten to twenty percent.
In-Checkout Upsells: How to Boost Shopify Order Value in 2026
Add in-checkout upsells on Shopify that lift AOV without dragging conversion. Offer construction, placement, targeting, and the apps that ship the highest-converting in-checkout modules in 2026.