
What Is a Good Shopify Conversion Rate in 2026?
A good Shopify conversion rate is above ~3.2% (top 20%); the median is ~1.4%. Benchmarks by device, industry, and funnel stage — plus how to find yours.
In this article
- 01 Key takeaways#
- 02 What counts as a good conversion rate?#
- 03 The conversion funnel: where your rate actually comes from#
- 04 Conversion benchmarks by device#
- 05 Conversion benchmarks by industry#
- 06 How to find and calculate your conversion rate#
- 07 Why is my Shopify conversion rate low?#
- 08 Frequently asked questions#
- 09 The bottom line#
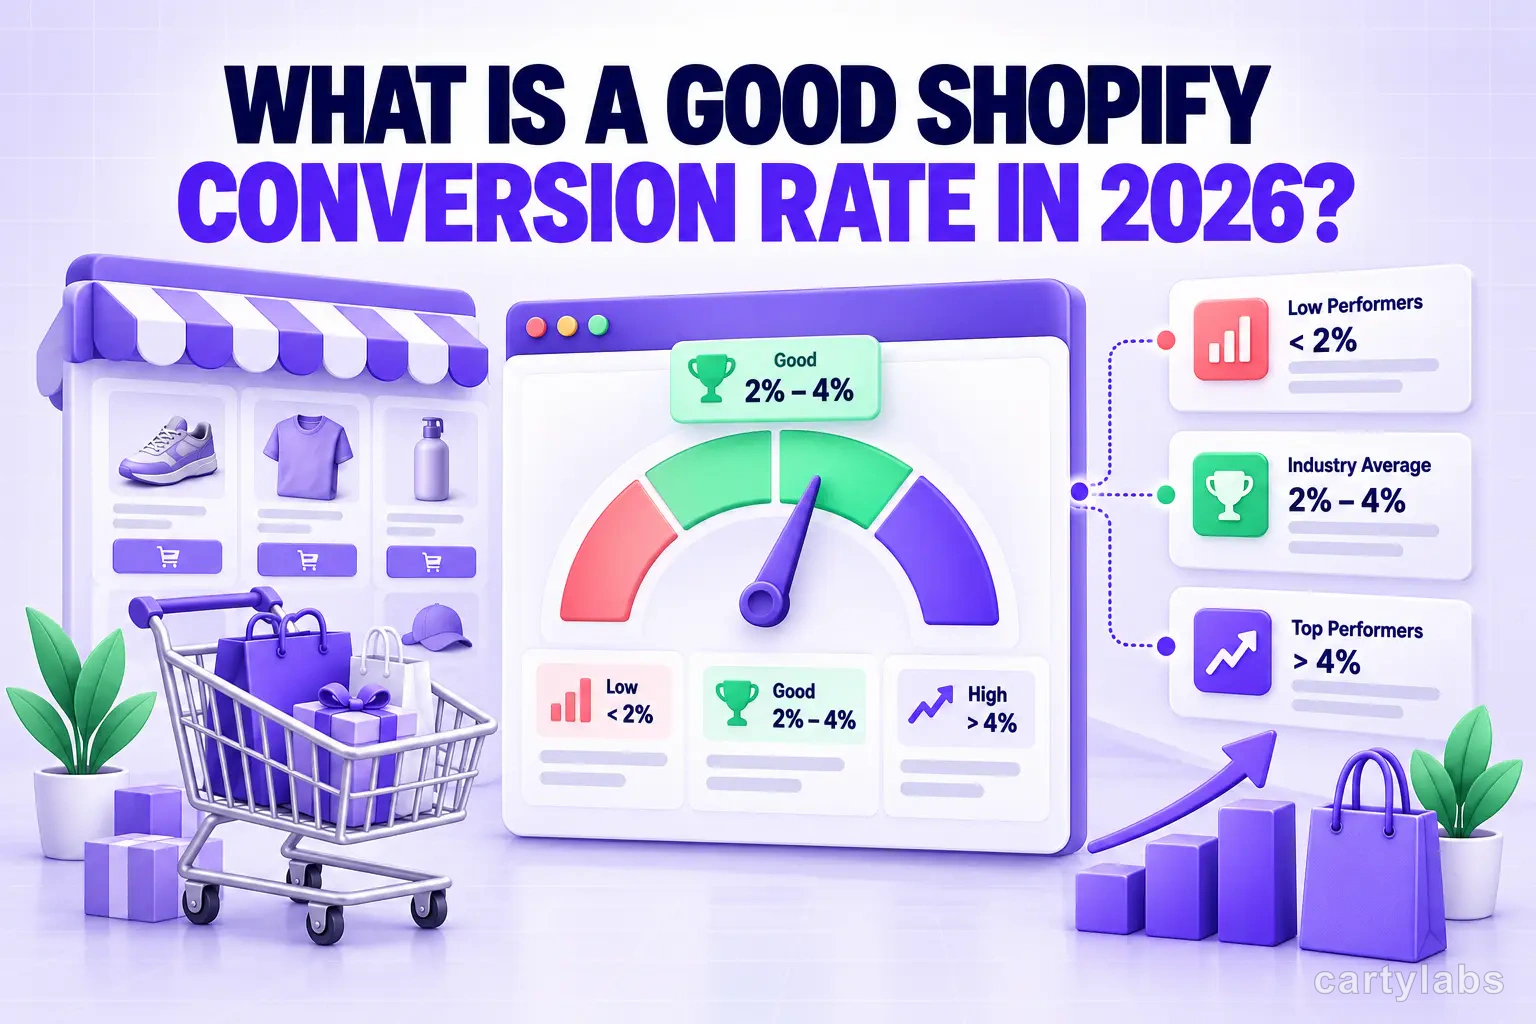
A good Shopify conversion rate in 2026 is roughly 3.2% or higher — that’s the top 20% of stores. The median Shopify store converts about 1.4%, according to Littledata’s benchmark of ~2,800 Shopify sites, so if you’re between 1.4% and 3.2% you’re doing fine, and above 3.2% you’re outperforming most stores. But there’s a real “it depends” here: your target shifts with your device mix, your industry, and where in the funnel you’re leaking. This guide gives you the benchmark for each, plus exactly how to find your own number in Shopify and GA4.
Key takeaways
- Median Shopify CVR ≈ 1.4%; good ≈ 3.2%+ (top 20%); elite ≈ 4.7%+ (top 10%) — Littledata.
- Ignore any “universal 2–3% average” — Shopify itself calls a universal benchmark “a fallacy.”
- Mobile converts lower than desktop (~1.2% vs ~1.9% on Shopify) yet drives ~76% of traffic, so a weak mobile experience drags your blended number down.
- Benchmark by funnel stage — add-to-cart rate, reached-checkout rate, and checkout completion each have their own healthy range. Fix the leaking stage, not “conversion” in general.
- The formula is orders ÷ sessions × 100; find it in Shopify Admin → Analytics and in GA4.
What counts as a good conversion rate?
The honest anchor is Littledata’s Shopify-specific benchmark, because it measures Shopify stores rather than all ecommerce:
| Tier | Store-wide conversion rate |
|---|---|
| Top 10% (elite) | above 4.7% |
| Top 20% (good) | above 3.2% |
| Average / median | ~1.4% |
| Needs work | below ~1% |
Two things merchants get wrong here. First, median vs. mean. Many blogs quote “2–3% is average,” but that’s a mean inflated by high performers; the Shopify median is closer to 1.4%, which is why so many stores feel like they’re “underperforming” a benchmark that was never realistic for them. Second, the source matters. Across live datasets, the “average ecommerce” number ranges from 1.6% globally (Statista, Q3 2025, via Shopify) to 2.03% (IRP Commerce, June 2026) to ~2.95% (Dynamic Yield) — the spread comes from different datasets and how each defines a “session.” Shopify’s own guidance is blunt: there’s no universal benchmark, though it notes a 7% conversion rate is “exceptionally strong.”
So: compare yourself to Shopify stores in your industry and on your device mix, not to a single global number.
The conversion funnel: where your rate actually comes from
Your store-wide conversion rate is the product of several stage rates. Diagnosing “low conversion” means finding which stage leaks:
Sessions → product views → add to cart → reached checkout → purchase.
- Add-to-cart rate varies enormously by category. Dynamic Yield’s 12-month benchmark puts Food & Beverage highest at ~10.2% and Luxury/Jewelry lowest at ~1.7%. If your add-to-cart rate is healthy but few of those carts convert, your problem is downstream, not on the product page.
- Reached-checkout rate is mostly a function of your cart experience — cart-page friction, free-shipping visibility, and whether you use a cart drawer vs. a cart page.
- Checkout completion is the final stage. Around 70% of carts are abandoned (Baymard), and once a shopper reaches checkout a different set of benchmarks takes over — completion rates by vertical, device, and AOV are covered in depth in our Shopify checkout conversion benchmarks and checkout abandonment statistics.
The practical value of the funnel view: a store at 1.5% with a great add-to-cart rate but a leaky checkout needs completely different fixes than one with a low add-to-cart rate and a clean checkout.
Conversion benchmarks by device
Device mix is the most common reason a store’s blended number looks low. On Shopify specifically, Littledata reports mobile ~1.2% (top 10% above 3.9%) versus desktop ~1.9% (top 10% above 6.5%). Yet mobile is ~76% of sessions (Dynamic Yield). That combination — the majority of your traffic on the lower-converting device — is exactly why mobile UX is the highest-leverage fix for most stores. See the mobile conversion optimization playbook. If your mobile rate is far below ~60% of your desktop rate, you have a fixable mobile-specific problem.
Conversion benchmarks by industry
Use this for orientation, not as a hard target — datasets differ, so treat these as directional:
| Source & segment | Conversion rate |
|---|---|
| Beauty & personal care — highest (Dynamic Yield, 12-mo avg) | ~5.37% |
| Arts & crafts (IRP Commerce, June 2026) | ~5.53% |
| Kitchen & home (IRP) | ~2.84% |
| Health (IRP) | ~2.58% |
| Sports (IRP) | ~1.95% |
| Fashion / apparel (IRP) | ~1.70% |
| Luxury & jewelry — lowest (Dynamic Yield, 12-mo avg) | ~0.71% |
The pattern is consistent: low-price, low-consideration, frequently-replenished categories convert highest; high-price, high-consideration, one-off purchases convert lowest. A jewelry store at 1% is doing well for its vertical even though it’s below the global median. For order-value context alongside these, see our AOV benchmarks by industry.
How to find and calculate your conversion rate
The formula Shopify uses is simple:
Conversion rate = Orders (purchases) ÷ Sessions × 100Note it’s sessions, not visitors, and a purchase counts as one completed order regardless of how many items it contains.
In Shopify Admin: go to Analytics, and find the Online store conversion rate card. Expand it to see the funnel, which Shopify breaks into these stages: all sessions → sessions with cart additions (added to cart) → sessions that reached checkout → sessions that completed checkout (sessions converted). Each stage’s rate is that stage’s sessions ÷ total sessions — so this one card tells you where you’re leaking. (See Shopify’s behavior reports documentation.)
In GA4: the equivalent is the Session key event rate — sessions with at least one key event ÷ total sessions. Mark the purchase event as a key event, then read Sessions, Key events, and Session key event rate in your reports. Google documents these in its dimensions and metrics reference. Expect GA4 and Shopify to differ by a few points — they define and attribute sessions differently, so pick one as your source of truth and track the trend rather than obsessing over the absolute gap.
Why is my Shopify conversion rate low?
Diagnose by stage, then fix that stage:
- Low add-to-cart rate? The problem is upstream — product pages, pricing clarity, or traffic quality. Start with product page best practices and a CRO checklist.
- Good add-to-cart, low reached-checkout? The cart is leaking. A conversion-focused cart drawer with a visible free-shipping bar and relevant upsells keeps shoppers moving instead of bouncing at the cart step.
- Good reached-checkout, low completion? The checkout itself is the issue — friction, trust, or payment options. Work the cart abandonment playbook and the deeper checkout benchmarks.
- Everything low on mobile only? Fix mobile UX first — it’s most of your traffic.
Want a fast estimate of what a rate change is worth in revenue? Run your numbers through our conversion rate calculator.
Frequently asked questions
Is a 2% conversion rate good for Shopify? Yes — 2% is above the Shopify median of ~1.4%, so a 2% store is converting better than most. It’s not top-tier (that’s ~3.2%+), but it’s a solid, healthy rate, especially for higher-consideration or mobile-heavy stores.
What is the average Shopify conversion rate in 2026? About 1.4% (median), per Littledata’s benchmark of ~2,800 Shopify stores. “Average ecommerce” figures run higher (1.6–3%) because they include non-Shopify data and use different session definitions.
How do I calculate my Shopify conversion rate? Divide orders by sessions and multiply by 100. Shopify shows this automatically in Admin → Analytics under “Online store conversion rate,” with the funnel broken into added-to-cart, reached-checkout, and sessions-converted.
Why is my Shopify conversion rate so low? Usually one funnel stage is leaking. Check your Admin funnel: a low add-to-cart rate points to product pages or traffic quality; a good add-to-cart but low reached-checkout points to a leaky cart; a good reached-checkout but low completion points to the checkout itself.
What is a good add-to-cart rate? It’s highly category-dependent — Dynamic Yield’s benchmark ranges from ~10% for food and beverage down to under 2% for luxury and jewelry. Benchmark within your industry, not against a single number.
Is mobile or desktop conversion rate higher? Desktop, typically — around 1.9% vs 1.2% for mobile on Shopify. Because mobile is roughly 76% of sessions, improving mobile UX usually lifts your blended rate the most.
The bottom line
A “good” Shopify conversion rate is above ~3.2%; the median is ~1.4%, and the right target depends on your device mix and industry. Stop chasing a single global benchmark and instead read your funnel: find the stage that’s leaking — product page, cart, or checkout — and fix that. The cart-to-checkout step, where a good cart drawer and upsells live, is one of the most fixable.
Losing shoppers between add-to-cart and checkout? Install Cartylabs free on Shopify to add a conversion-focused cart drawer, free-shipping bar, and upsells that keep more sessions moving toward purchase.
Related reading: Shopify checkout conversion benchmarks, Mobile conversion optimization, The Shopify CRO checklist.
Next steps
Related Shopify resources
Practical tools and product pages related to this guide.
Keep reading
All articles →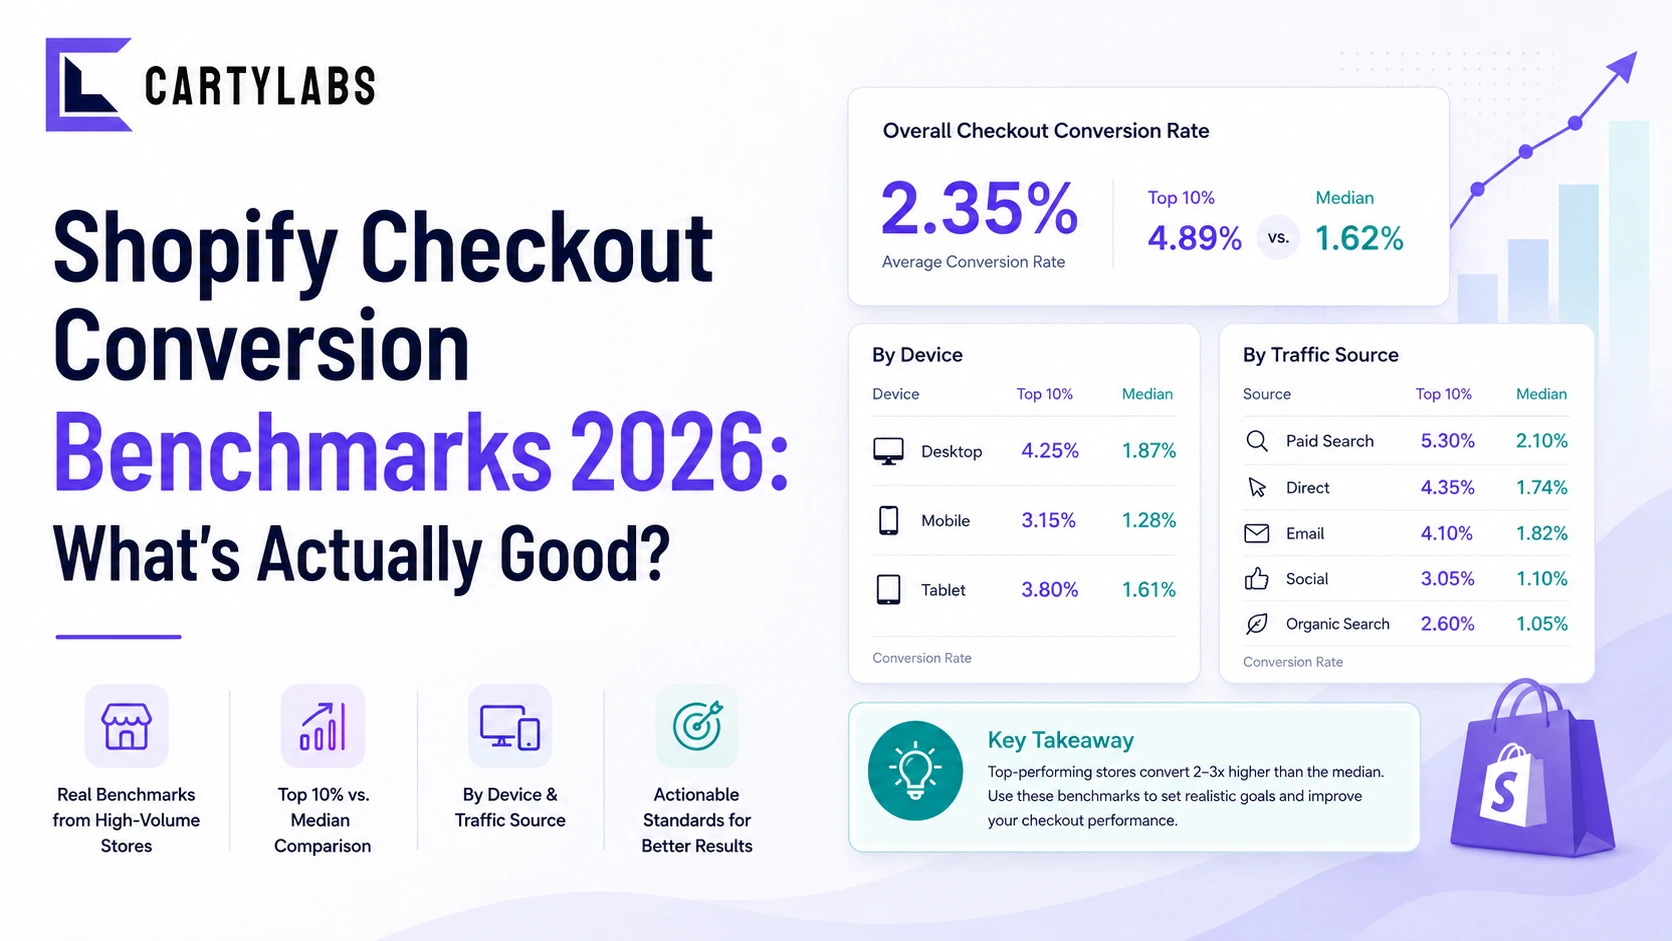
Shopify Checkout Conversion Benchmarks 2026: What's Actually Good?
The full benchmark set for Shopify checkout conversion in 2026, by tier, vertical, device, and traffic source. What separates the top 10% from the median, with the methodology behind every number.

Cart Icon UX: 9 Patterns That Reduce Drop-Off
Shopify cart icon UX best practices: 9 patterns that reduce drop-off and lift cart re-engagement, with examples and conversion data from 2026.
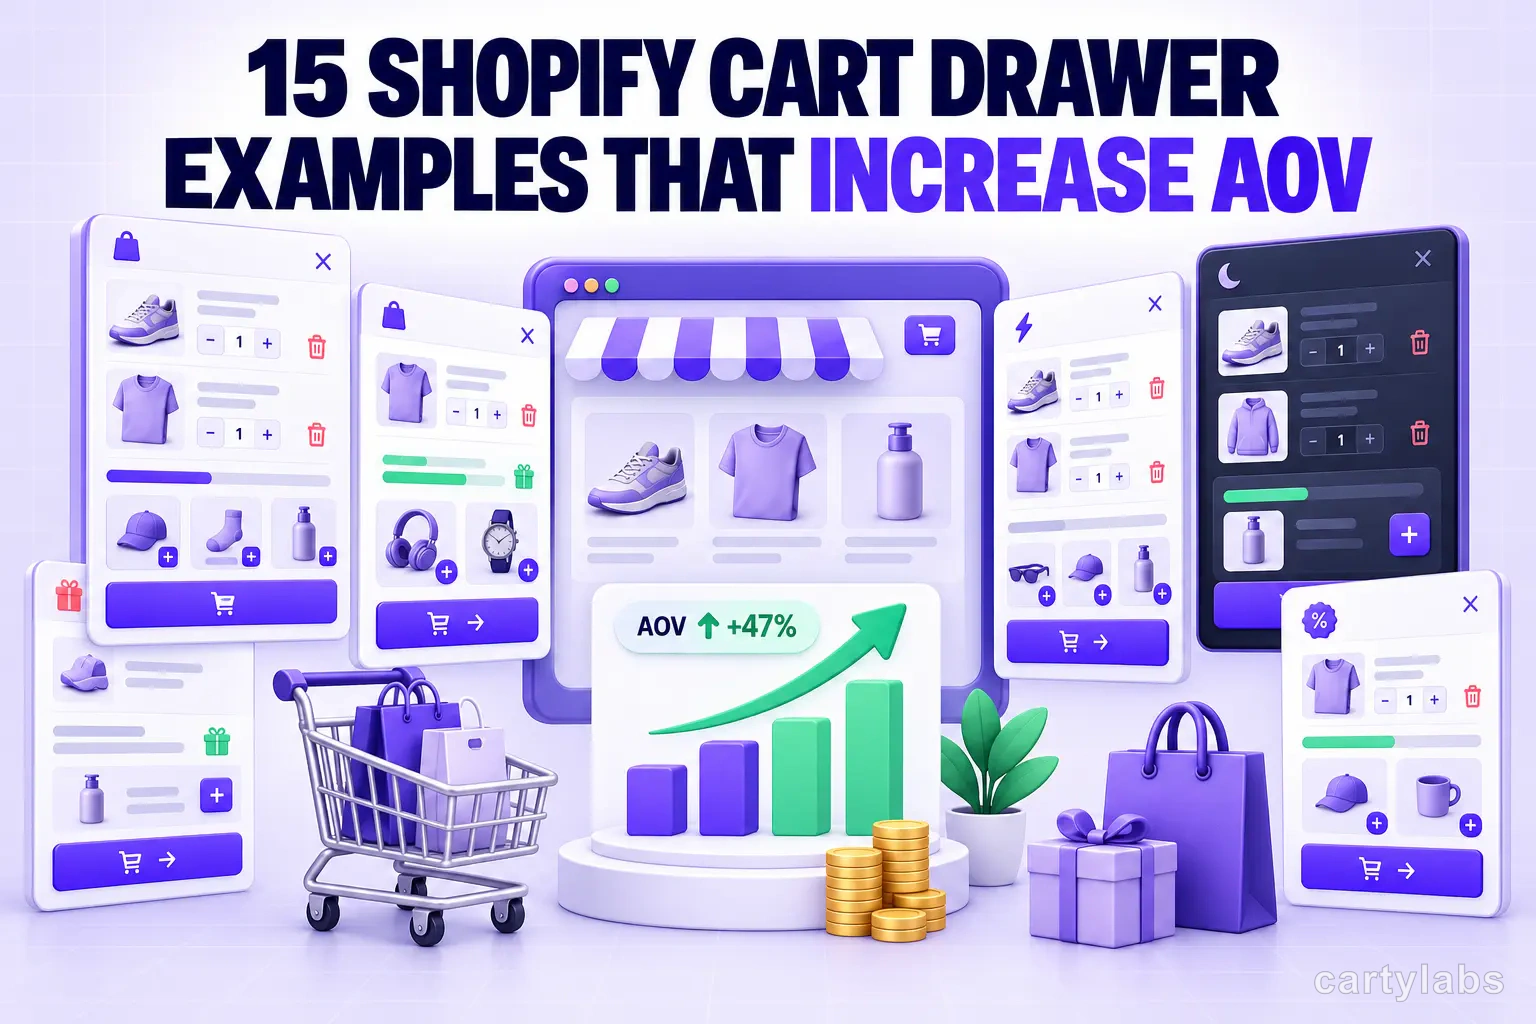
15 Shopify Cart Drawer Examples That Increase AOV
15 real Shopify cart drawers, graded on free-shipping bars, upsells, bundles, rewards, and mobile UX — with the exact tactic to copy from each.
 Install Cart — Free