
Shopify Cart Analytics: What Growth Reports Reveal
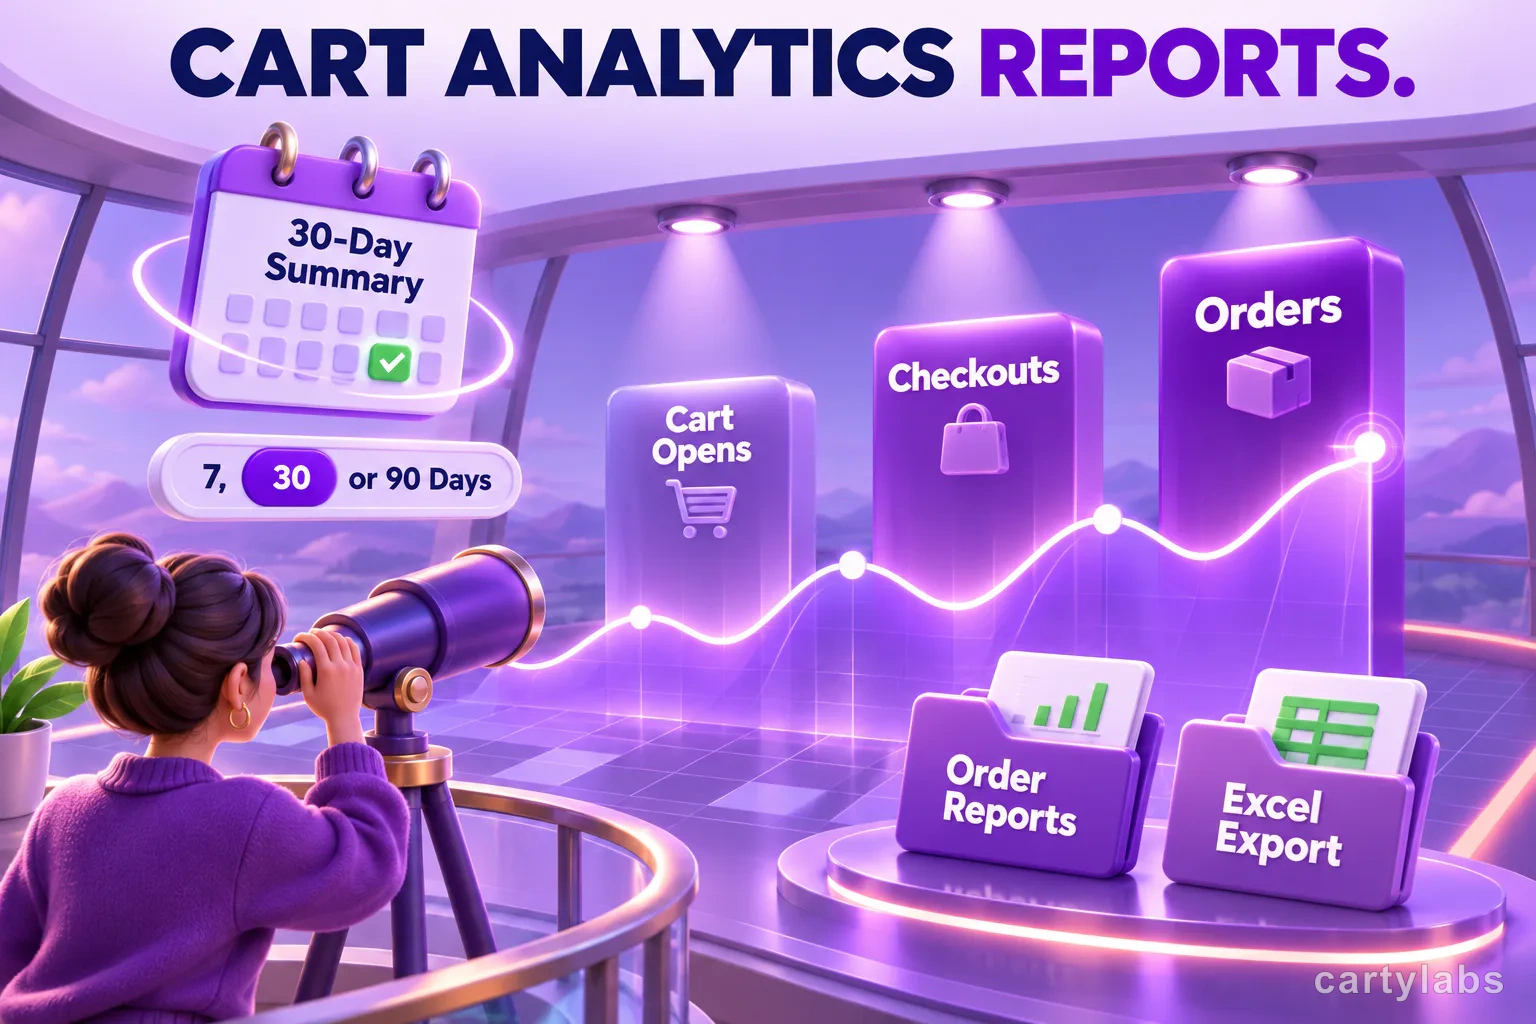
Shopify cart analytics in Cartylabs range from a Free 30-day summary to Growth conversion, engagement, order reports, shopper journeys, and Excel export.
In this article
Analytics are most useful when they answer a question you can act on. Did shoppers open the cart? How many moved on to checkout? Are recommended products being added? Cartylabs includes a 30-day performance summary on the Free plan, with more detailed conversion, engagement, order reporting, and an Excel export on Growth. Use the summary to check cart activity, then move to Growth when you need deeper context for merchandising or conversion decisions.
For a deeper look at individual paths through visits, cart steps, and orders, read the guide to Shopify shopper journeys after BFCM.
Use these reports to understand how shoppers interact with your cart and how that activity relates to orders. They are practical decision tools, not a complete account of every shopper choice. Read the metric definitions alongside the totals so you know exactly what each number represents.
Key takeaways
- The Free plan includes a 30-day performance summary; Growth adds conversion, engagement, order reporting, and Excel export.
- Growth analytics can help review cart-to-checkout activity, recommendations, orders, and shopper journeys.
- Use journey details as context for investigation, not proof that a cart feature caused an order.
- Compare equivalent date ranges and read metric definitions before acting on a change.
What the Free 30-day summary helps answer
The Free plan includes a 30-day performance summary for a quick read on cart and buy-button activity. Use it to see whether visitors open the drawer, move toward checkout, or use a sticky add-to-cart button or quick-buy entry point. It answers the first practical question: which parts of the shopping experience are getting used?
A coffee shop can review the summary after adding a cart drawer to see whether shoppers open it and proceed toward checkout. If many shoppers open the cart but fewer continue, the team has a clear place to inspect: product information, shipping details, or the checkout path. Use the 30-day view to identify where to focus the next improvement.
Review the summary alongside store context. A campaign, seasonal rush, or change in traffic can move cart activity too, so compare periods with those changes in mind. The summary is a fast way to spot a pattern and decide what to investigate next.
What Growth adds
Growth adds conversion, engagement, and order reporting to help explain how cart activity connects to shopper progress and online orders. Use it to answer questions such as:
- How many cart opens lead to checkout clicks?
- How many online orders are associated with use of the cart drawer?
- What sales are attributed to those orders?
- How often are recommendation products added, and how many orders include a recommended item?
- Which products appear in recommendation or buy-button activity?
- What do shopper journeys look like across visits and cart interactions?
Choose a 7, 30, or 90-day range to compare performance over time. Growth reports include detail on cart activity, recommendations, and buy buttons, with breakdowns that help teams see when and how shoppers engage. For example, a merchant can compare checkout activity across periods, review which recommended products are added, and see how those additions relate to orders.
Growth also includes an Excel export with summary, daily, product, order, and shopper data. Use it to sort product results, prepare a report for a team meeting, or combine cart performance with your own merchandising calendar. The added detail turns a broad trend into a focused follow-up, such as reviewing the recommendations on products shoppers frequently add.
What the numbers mean
Cart opens count when the cart opens, not when a shopper looks at a recommendation. Revenue is gross, before refunds or cancellations. Today’s figures are still in progress and can change throughout the day. An order that includes a recommended product shows an association, not proof that the recommendation caused the purchase.
Questions to take to the data
Start with one decision: check cart opens and checkout activity to understand the cart path, or review recommendation adds and associated orders to assess your product suggestions. Compare complete date ranges and account for promotions or traffic changes. Use the Excel export when you need to examine order, shopper, product, or daily details.
Turn a report into a next step
A report is most valuable when it points to a concrete improvement. If cart opens are healthy but checkout activity is weaker, walk through the cart on a phone and check whether delivery information, product options, and the checkout button are easy to find. If shoppers add recommended products, review the products and placements that perform well, then make sure the other recommendations complement the same kind of cart. If orders associated with the cart are moving in a different direction from total orders, compare the periods and check what else changed in your store.
Growth gives teams more context for these reviews. A merchandising manager can use product details to identify which suggestions deserve a closer look. A store owner can compare daily performance with a promotion calendar. A team preparing a monthly review can use the workbook to share the same summary and supporting product or order details. Keep the question consistent across those views so everyone is discussing the same date range and measure.
A simple routine works well: review the Free summary to notice broad changes, then use Growth reports when you need more detail about conversion, products, journeys, or orders. Record the change you make and review a comparable period afterward. That makes the report part of an ongoing improvement cycle rather than a dashboard the team checks without a decision in mind.
For example, if a promotion drives more cart activity, compare the product mix and checkout progress with a similar period before changing the cart itself. If a popular item has few related product additions, refresh its complementary suggestions and review the next reporting period. Small, specific adjustments are easier to evaluate than changing several parts of the cart at once.
The Free 30-day summary shows whether shoppers are using the cart experience. Growth adds deeper conversion, engagement, order, and journey reporting, plus Excel export for follow-up. See Cartylabs pricing and cart drawer features for details.
FAQ
What analytics are included on the Free plan?
Free includes a 30-day performance summary. Growth adds conversion, engagement, and order reporting, plus Excel export.
What can I learn from shopper journeys?
Journeys show recorded visits and steps such as cart opens, product changes, checkout clicks, and orders. They provide context for investigation, not a complete record of every shopper choice.
Can analytics prove a cart change caused more orders?
No. Reports and journeys show measured activity and associations, not causation. Compare periods carefully and investigate other changes in traffic, campaigns, and the store.
Next steps
Related Shopify resources
Practical tools and product pages related to this guide.
Keep reading
All articles →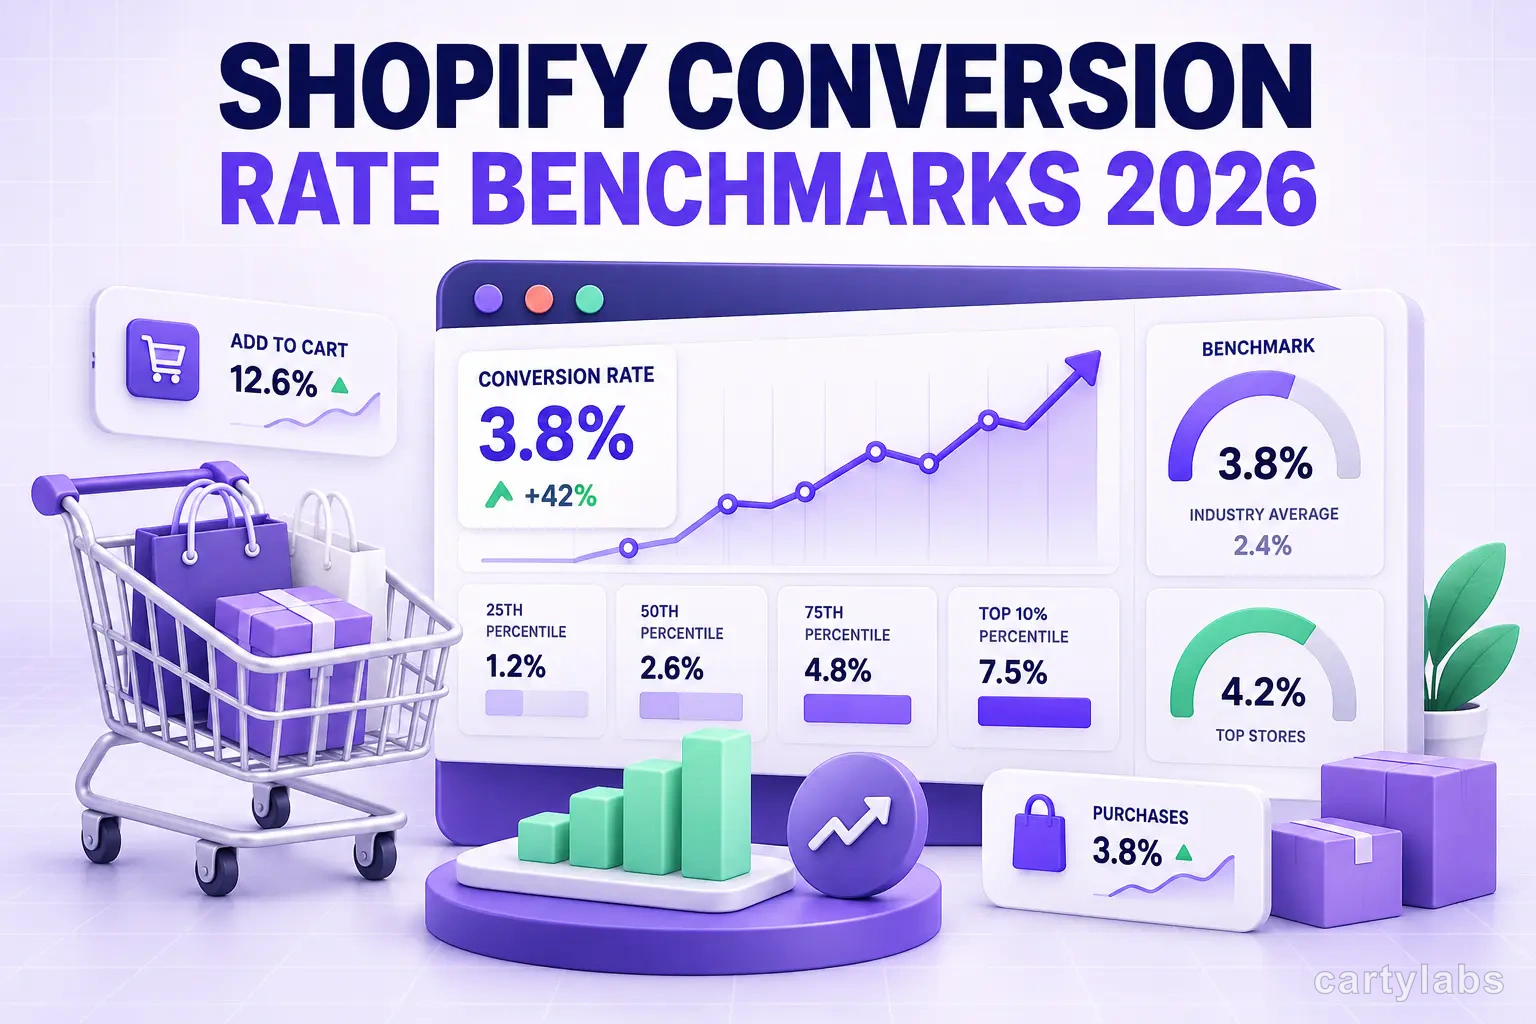
Shopify Conversion Rate Benchmarks 2026 (by Vertical)
Shopify conversion rate benchmarks for 2026, broken down by vertical, device, and traffic source. Real numbers, honest medians, and what to fix first.
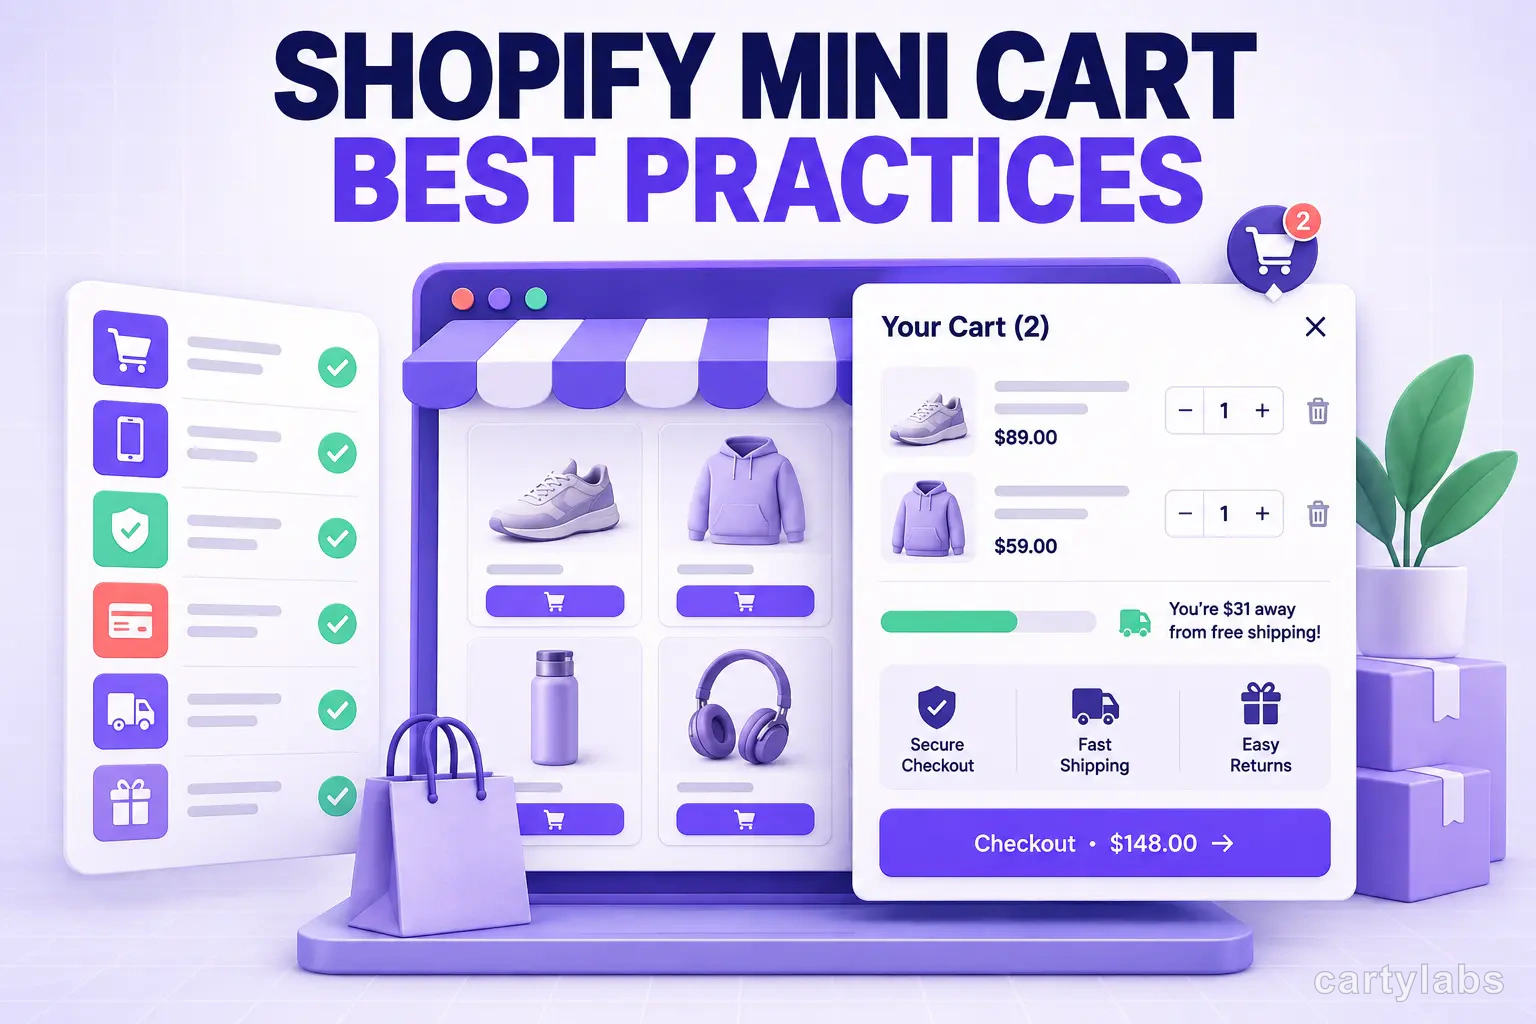
Shopify Mini Cart Best Practices (with Examples)
Shopify mini cart best practices: layout, copy, mobile rules, and 12 patterns from high-converting stores. Concrete examples and AOV data for 2026.
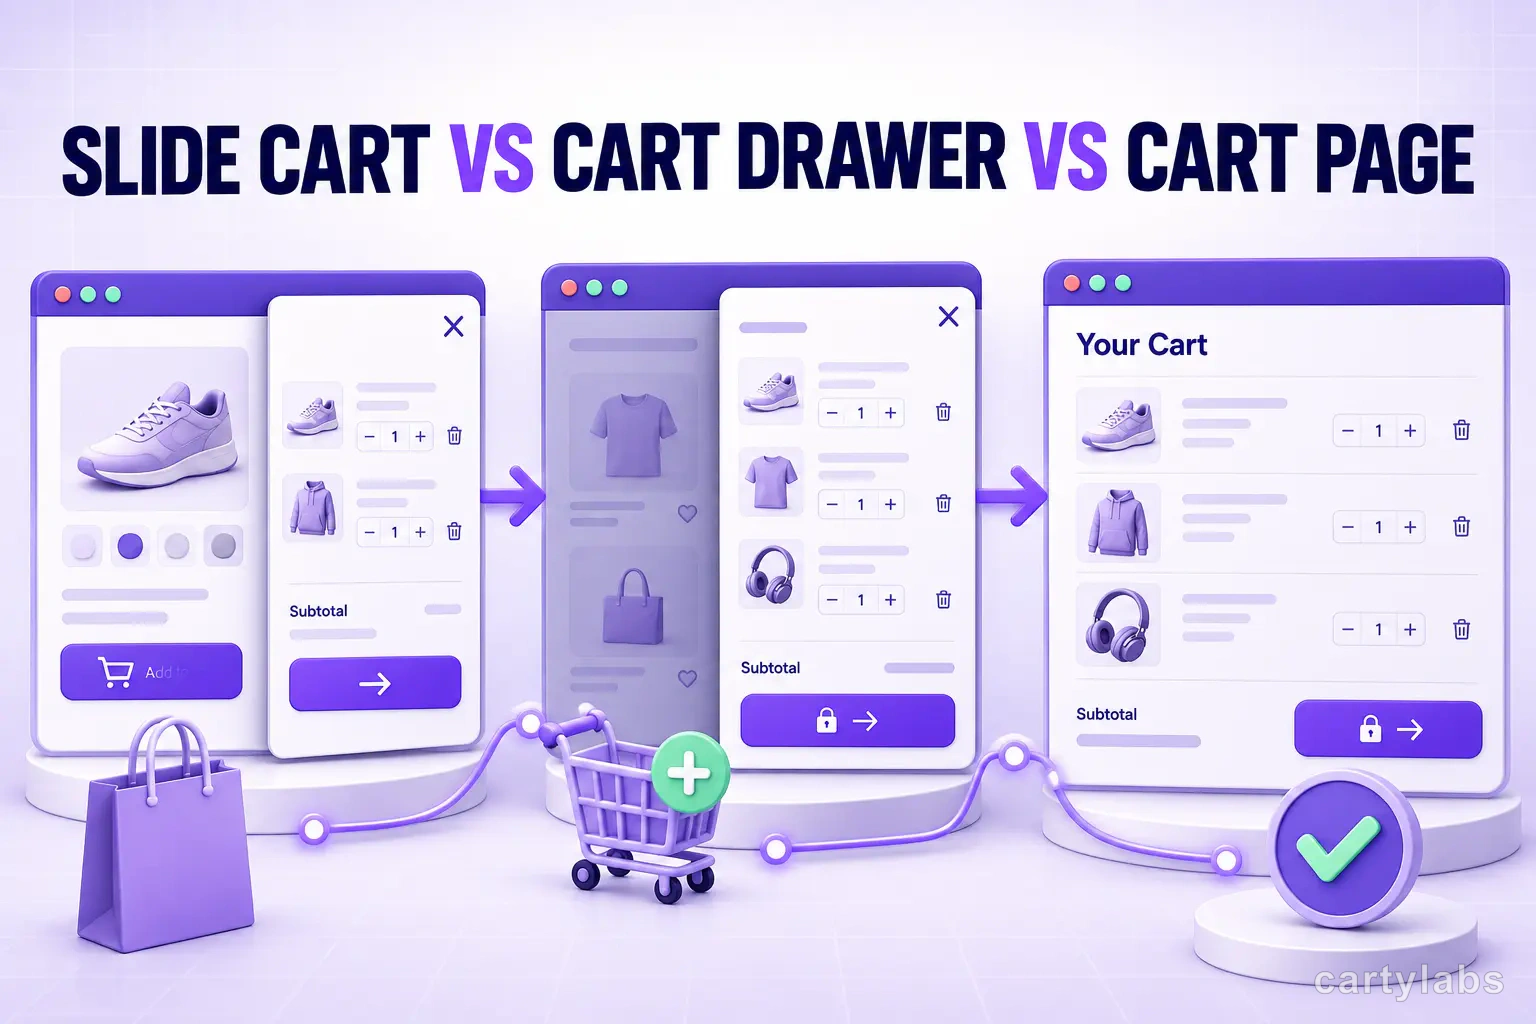
Slide Cart vs Cart Drawer vs Cart Page: Which Converts Best?
Slide cart vs cart drawer vs cart page: a data-backed breakdown of which Shopify cart UX converts best, when each one wins, and how to pick for your store.
 Install Cart — Free